![]()
Beautiful Plants For Your Interior
If you looked up your state’s drinking water on the EPA’s official compliance database , you would likely find a score somewhere between 72% and 100%. You might conclude your water is safe.
You could be wrong — and we have the independent data to show you exactly why.
This guide rates all 50 US states on a 1-to-5 star scale using a five-factor composite methodology that goes well beyond what official government scores capture. The single biggest factor the EPA’s database misses: PFAS contamination — the “forever chemicals” now confirmed in the drinking water of an estimated 176 million Americans.

The EPA’s Safe Drinking Water Information System (SDWIS) measures compliance with standards that were largely written in the 1990s. The system has three fundamental blind spots that make state rankings based solely on SDWIS data dangerously misleading:
PFAS testing wasn’t required until 2023. Every state compliance score published before that year — and used in current rankings — was calculated without any PFAS data whatsoever.
The Lead and Copper Rule requires testing at water treatment facilities — not at the tap in your home. Contamination from aging lead service lines between the plant and your faucet is entirely invisible to SDWIS. This is how Flint, Michigan showed zero violations in the database while children were being poisoned.
The EPA has not adopted a single new standard for an unregulated contaminant since 1996. Of the estimated 90,000+ chemicals in commercial use, fewer than 100 have legal limits in drinking water. A state can score 95/100 while its residents drink water containing dozens of unregulated contaminants.
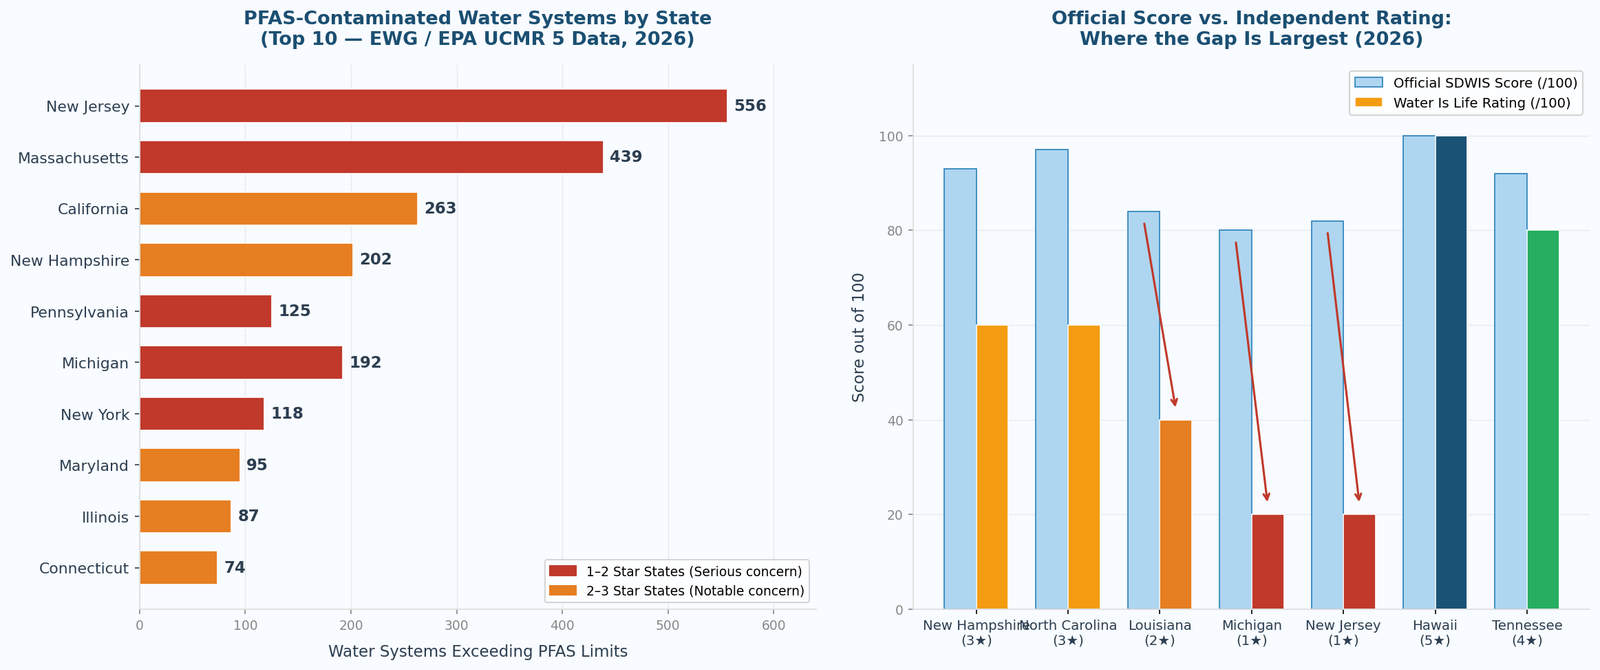
The two charts below capture the most important data points driving our state ratings. On the left: the states with the most water systems exceeding PFAS safety limits — the contamination that official scores miss entirely. On the right: how dramatically official scores can diverge from what independent data actually shows.
Each state is scored out of 100 across five independent factors, then converted to a 1-to-5 star rating. The weighting is specifically designed to surface contamination that official scores miss.
Number of confirmed contamination sites, estimated population exposed, and PFAS detected above EPA MCLs per EWG and UCMR 5 data. Weighted highest because SDWIS doesn’t capture it and 176 million Americans are currently exposed.
Presence of pre-1986 lead service lines, documented exceedances, and known crises including Flint MI, Newark NJ, and Jackson MS. SDWIS consistently under-reports lead because testing occurs at treatment plants, not at the tap.
Official health-based violations from SDWIS and TapWaterData. Used as a floor, not a ceiling. States with low violation rates but high PFAS contamination are not rewarded for compliance with outdated standards.
TTHMs and HAA5s from EWG Tap Water Database and Clearly Filtered independent analysis. These chlorination byproducts are linked to cancer and birth defects and are rampant in several major states.
Chronic noncompliance, small system failures (80%+ of health violations occur in systems serving under 3,300 people), percent on private wells, and documented disparities in vulnerable communities.
| Rating | Stars | What It Means | Recommended Action |
|---|---|---|---|
| 1 Star | ★☆☆☆☆ | Serious contamination concerns across multiple independent sources. SDWIS data significantly understates the real risk. Filtration is not optional. | RO system + NSF 53 lead filter. Test your tap. Do not drink unfiltered. |
| 2 Stars | ★★☆☆☆ | Notable contamination documented by independent testing. Official compliance scores do not fully reflect real risk. Filtration strongly recommended. | Reverse osmosis or high-quality activated carbon system recommended. |
| 3 Stars | ★★★☆☆ | Some contamination concerns, often localized or driven by specific contaminants. Filtration is a prudent precaution. | Activated carbon filter at minimum; RO if near known contamination source. |
| 4 Stars | ★★★★☆ | Generally good water quality with minor or localized concerns. Some PFAS near military installations or natural mineral issues in private wells. | Standard carbon filter sufficient for most; well owners test annually. |
| 5 Stars | ★★★★★ | Excellent water quality confirmed by both official and independent testing. Very low contamination across all five scoring factors. | Standard carbon filter for taste; water is genuinely safe. |
The table below rates all 50 states alphabetically using our 5-factor composite methodology. Click your state to read the full detailed report including district-level data, specific contaminants, your local Consumer Confidence Report guidance, and filter recommendations tailored to your primary water threat.
| State | Rating | Primary Concern | Recommended Action |
|---|---|---|---|
| Michigan | ★☆☆☆☆ | PFAS: 192+ confirmed PFAS sites — the most of any state; Flint lead crisis legacy; private well recorded at 72,300 ppt PFAS | Reverse osmosis essential; NSF 53 certified filter for lead; test tap immediately |
| New Jersey | ★☆☆☆☆ | PFAS + Lead: 556 PFAS-exceeding systems — #1 nationally; Newark lead crisis; 294,554 lead pipes; chromium-6 affects 7.5M residents | Reverse osmosis + NSF 53 lead filter; do not drink unfiltered tap water |
| New York | ★☆☆☆☆ | DBPs + PFAS: 20M+ exposed to TTHMs/HAA5s/arsenic; Suffolk County PFAS at 92.8 ppt; Syracuse lead 4x EPA action level | Reverse osmosis for PFAS and DBPs; NSF 53 lead filter for older buildings |
| Pennsylvania | ★☆☆☆☆ | Lead + PFAS: 261,023 lead pipes statewide; 19% of tested systems exceed PFAS standards; Pittsburgh lead exceedances documented | NSF 53 lead filter + RO for PFAS; request Consumer Confidence Report today |
| California | ★★☆☆☆ | PFAS + Arsenic: 263 PFAS-exceeding systems; Fresno at 194.3 ppt; USGS finds Central and Southern CA most PFAS-exposed | Reverse osmosis (NSF 58); RO also removes arsenic and nitrates in Central Valley |
| Connecticut | ★★☆☆☆ | PFAS + Lead: High PFAS from military and industrial sites; old colonial housing stock with lead risk; elevated disinfection byproducts | Reverse osmosis + lead pre-filter; test all pre-1986 homes for lead |
| Delaware | ★★☆☆☆ | PFAS: New Castle detected at 270 ppt PFAS — among the highest levels documented nationally | Reverse osmosis essential (NSF 58 certified); RO removes PFAS below detection limits |
| Florida | ★★☆☆☆ | DBPs: Bromodichloromethane detected in 280+ cities; gross alpha radiation widespread; PFAS from military bases in north FL | Activated carbon + RO combo; test for gross alpha if on well water in north FL |
| Illinois | ★★☆☆☆ | Lead + PFAS: 1.04M lead pipes — 11.35% of entire US total; Chicago PFAS levels up to 1,800x health advisory in some systems | NSF 53 lead filter mandatory; RO system for PFAS-affected Chicago area |
| Louisiana | ★★☆☆☆ | Lead + PFAS + DBPs: England AFB groundwater at 10.97 million ppt PFAS; 88% of New Orleans homes tested positive for lead; 900+ systems with high TTHMs | Full RO system + NSF 53 lead filter; do not drink unfiltered tap water |
| Maine | ★★☆☆☆ | Arsenic + PFAS: Naturally occurring arsenic from granite bedrock affects private wells; high PFAS from military sites; aging rural infrastructure | RO system removes arsenic and PFAS; well owners must test annually |
| Massachusetts | ★★☆☆☆ | PFAS + DBPs: 439 PFAS-exceeding systems — #2 nationally; Pease AFB was one of the first documented US PFAS crises; Springfield HAA5 exceeded federal limits | Reverse osmosis for PFAS; activated carbon for disinfection byproducts |
| Mississippi | ★★☆☆☆ | Lead: Jackson lead crisis reached 476 ppb — 31x the federal action level; catastrophic infrastructure collapse; significant environmental justice concerns | NSF 53 lead filter critical; RO recommended; follow all local boil advisories |
| Missouri | ★★☆☆☆ | Violations + DBPs: 2nd lowest SDWIS compliance score nationally; high disinfection byproducts statewide; agricultural runoff in rural areas | Activated carbon + RO; well owners test annually for nitrates |
| Nevada | ★★☆☆☆ | Arsenic + Violations: Las Vegas ranked among the most contaminated large US cities; arsenic in desert groundwater; chromium-6 concerns statewide | Reverse osmosis system for arsenic and chromium-6; test Las Vegas tap water |
| Ohio | ★★☆☆☆ | PFAS + Industrial: DuPont Washington Works PFAS discharge history; chemical plants discharging into Ohio River for decades; Toledo harmful algae bloom history | RO system for PFAS; activated carbon for industrial chemical byproducts |
| Oklahoma | ★★☆☆☆ | Violations + DBPs: Lowest SDWIS compliance score in the entire US (72.6/100); independently ranked among the highest for disinfection byproduct levels | Activated carbon + RO combo; request Consumer Confidence Report from utility |
| Rhode Island | ★★☆☆☆ | Lead + PFAS: Very old colonial-era infrastructure throughout the state; high PFAS from military and industrial sites; elevated lead levels widespread | Lead filter + RO system; test all pre-1986 homes and rental apartments |
| Texas | ★★☆☆☆ | DBPs + Lead: 647,640 lead pipes — 7% of entire US total; bromodichloromethane and DBPs in most major cities; 55% rise in boil-water notices since 2018 | NSF 53 lead filter + activated carbon for DBPs; well owners test for nitrates |
| West Virginia | ★★☆☆☆ | PFAS + Chemical: DuPont PFAS discharge history (C8 contamination); 2014 Elk River chemical spill contaminated 300,000 residents’ water supply | RO system for PFAS and residual chemical contamination |
| Alabama | ★★★☆☆ | PFAS + DBPs: PFAS from military installations; TTHMs in 800+ systems affecting 9M+ residents; some environmental justice community violations | Activated carbon filter; test for PFAS if near Maxwell, Redstone, or other military bases |
| Alaska | ★★★☆☆ | Infrastructure: Small remote system failures; septic contamination in rural communities; corroded underground storage tanks; significant indigenous community gaps | UV purification + multi-stage filtration for well users; contact local utility for specifics |
| Arizona | ★★★☆☆ | PFAS + Arsenic: PFAS from Luke AFB and other military sites; arsenic naturally occurring in desert geology; small system compliance gaps throughout rural areas | RO system for arsenic and PFAS; well water must be tested before use |
| Arkansas | ★★★☆☆ | Agricultural: Agricultural runoff affecting rural wells; moderate disinfection byproduct levels; some infrastructure age concerns in smaller municipalities | Activated carbon filter; well owners test annually for nitrates and pesticides |
| Georgia | ★★★☆☆ | PFAS + DBPs: PFAS from 3 military bases at levels up to 5,000x the recommended limit; TTHMs and chloroform in 800+ systems affecting 9M residents | RO system if near military installation; activated carbon statewide for DBPs |
| Indiana | ★★★☆☆ | PFAS: Industrial corridor PFAS contamination from manufacturing legacy; older city infrastructure in Gary and Hammond; some agricultural runoff in rural areas | RO for PFAS in industrial areas; activated carbon filter for general residential use |
| Kansas | ★★★☆☆ | Violations + Nitrates: Below-average SDWIS compliance; agricultural nitrate runoff widely detected in rural water supplies from fertilizer use | RO system for nitrates; request local CCR report; well owners test every two years |
| Kentucky | ★★★☆☆ | PFAS + Mining: PFOS detected in Pendleton County groundwater; coal mining contamination legacy; Appalachian rural infrastructure gaps and aging systems | Activated carbon + RO; well owners test for mining byproducts and PFAS |
| Maryland | ★★★☆☆ | DBPs + PFAS: 379 water systems with elevated TTHMs affecting 5M+ residents; Chesapeake Bay watershed PFAS; aging Baltimore infrastructure | Activated carbon for DBPs; RO in Chesapeake watershed communities |
| Minnesota | ★★★☆☆ | PFAS: 3M manufacturing legacy left significant PFAS contamination in Twin Cities metro area groundwater; contamination ongoing in Washington County wells | RO system if in Twin Cities metro; test all private wells annually statewide |
| New Hampshire | ★★★☆☆ | PFAS: 202 PFAS-exceeding systems — #4 nationally; Pease Air Force Base triggered one of the first documented US PFAS drinking water crises. Official score of 93/100 masks serious real-world risk. | RO system essential; do not rely on the official SDWIS score as a safety indicator |
| New Mexico | ★★★☆☆ | PFAS + Access: Cannon AFB PFAS threatens dairy region groundwater; Navajo Nation faces severe water access and safety crisis; rural infrastructure gaps | RO for PFAS near military sites; contact Indian Health Service for Navajo Nation resources |
| North Carolina | ★★★☆☆ | PFAS: Wilmington GenX contamination was independently discovered after decades undetected; Robeson County at 149.7 ppt. 2nd best SDWIS score in the nation significantly understates real risk. | RO system essential in eastern NC; the official ranking significantly understates contamination |
| Oregon | ★★★☆☆ | DBPs + Nitrates: High TTHMs per independent testing; Morrow County nitrates at 4x EPA limit from agricultural dumping; Portland Airport PFAS contamination | Activated carbon for DBPs; RO near Portland; test wells for nitrates in eastern OR |
| Wisconsin | ★★★☆☆ | PFAS + Agricultural: PFAS from dairy and agricultural land application of contaminated sludge; military contamination sites; rural well water infrastructure gaps | Test well water for PFAS; activated carbon or RO depending on results; see WI DNR resources |
| Colorado | ★★★★☆ | PFAS (local): Peterson AFB PFAS contamination in Colorado Springs area; excellent statewide water quality from Rocky Mountain snowmelt otherwise | Test if near military installation; standard activated carbon filter is sufficient elsewhere |
| Idaho | ★★★★☆ | Arsenic (natural): Some naturally occurring arsenic from volcanic geology in private wells in certain regions; generally very low contamination statewide | RO if arsenic detected in well test; municipal water is among the safest in the US |
| Iowa | ★★★★☆ | Nitrates (rural): Agricultural nitrate runoff affects some rural counties and private wells; strong municipal system compliance throughout urban areas | Well owners test annually for nitrates; RO if elevated; municipal users generally safe |
| Montana | ★★★★☆ | Access (remote): Some indigenous and remote community water access gaps; otherwise very clean water statewide from natural mountain sources | Standard carbon filter; well owners test annually as standard precaution |
| Nebraska | ★★★★☆ | Nitrates (rural): Agricultural nitrate contamination affects some rural private wells in the Platte River valley; generally good municipal compliance | Well owners test for nitrates; RO if elevated; municipal water generally safe to drink |
| North Dakota | ★★★★☆ | Access (tribal): Some indigenous community water infrastructure concerns on tribal lands; otherwise low contamination levels throughout the state | Standard filtration; well owners conduct standard annual water test |
| South Carolina | ★★★★☆ | Minor PFAS: Ranked #1 in combined state water quality (EPA + EWG aggregate ranking); minor PFAS risk near military installations in the Midlands | Standard activated carbon filter; test if within 20 miles of a military base |
| South Dakota | ★★★★☆ | Access (tribal): Indigenous community water infrastructure gaps on tribal lands; very low contamination statewide in municipal systems | Standard carbon filter; well owners test annually as standard practice |
| Tennessee | ★★★★☆ | Minor concerns: Memphis consistently ranks as the cleanest large US city nationally; excellent EPA compliance record maintained across the state | Standard activated carbon filter is sufficient for most Tennessee households |
| Utah | ★★★★☆ | Hard water: Provo ranks among the cleanest US cities nationally; primary concern is mineral hardness — a comfort and appliance issue, not a health contaminant | Water softener for hard water; drinking water safety is otherwise excellent statewide |
| Vermont | ★★★★☆ | Minor PFAS + Lead: Some PFAS from small military sites; older housing stock carries lead risk in specific buildings; otherwise excellent statewide water quality | Test pre-1986 homes for lead; carbon filter for general household use |
| Virginia | ★★★★☆ | Minor PFAS: PFAS concerns near Quantico and Norfolk military bases; Henrico County won the 2025 national water taste award — one of the safest states overall | Test if within 20 miles of military base; otherwise one of the safest states in the US |
| Washington | ★★★★☆ | Minor PFAS: PFAS from Boeing facilities and military sites in specific areas; generally very clean statewide water quality from Cascade snowmelt and deep aquifers | Test if near industrial or military sites; standard carbon filter for general use |
| Wyoming | ★★★★☆ | Natural minerals: Some naturally occurring minerals in rural private wells; municipal water is among the safest in the US from clean mountain sources | Well owners: annual standard water test; municipal water is genuinely safe |
| Hawaii | ★★★★★ | None significant: Highest SDWIS score in the US (99.9/100); geographic isolation limits all industrial contamination sources; minimal PFAS detected | Standard carbon filter for taste; Hawaii has the genuinely cleanest tap water in the nation |

Your state’s star rating tells you the general picture. But your personal risk can be higher — or lower — depending on factors that vary significantly within states.
Lead service lines and lead solder in plumbing are common in pre-1986 construction. This applies even in 4-star states. Test before drinking unfiltered water in older homes.
Private wells are entirely exempt from federal testing requirements. Your well could have serious contamination completely unknown to any authority. Annual testing is essential.
These are the primary sources of PFAS contamination. PFAS travels long distances through groundwater, contaminating wells and municipal intakes miles away from the source.
Systems serving fewer than 3,300 people account for 80%+ of all health-based violations. These utilities have the fewest resources for compliance, treatment, and testing.
Only reverse osmosis (NSF 58 certified) and certain activated carbon block filters remove PFAS below detection limits. Standard pitcher filters are not sufficient.
NSF 53-certified filters or reverse osmosis. A filter is not sufficient just because it is labeled “water filter” — verify NSF 53 certification specifically.
High-quality activated carbon block filters effectively reduce TTHMs and HAA5s. For maximum protection, combine activated carbon with a reverse osmosis membrane.
Reverse osmosis is the most effective technology. Activated carbon alone does not remove arsenic. Critical for private well owners in Arizona, Maine, and Idaho.
Reverse osmosis removes nitrates. Activated carbon does not. Essential for private well owners in agricultural areas across Iowa, Nebraska, Kansas, and Oregon.
A water softener or salt-free conditioner addresses mineral hardness. This is primarily a comfort and appliance protection issue, not a health safety concern in most cases.
If your home uses a private well, our comprehensive guide covers iron, sulfur, PFAS, bacteria, and sediment filtration across all budgets.
Hard water affects 85% of US homes. Our whole-house guide covers softeners, salt-free conditioners, and combination systems.
Campground water quality is unpredictable regardless of which state you are traveling through. Our guide covers inline, canister, and countertop systems.
Wells, springs, rainwater, and cisterns each require specific multi-stage treatment. Our guide covers gravity, UV, and no-power RO systems.
Last updated: March 2026 | Water Is Life — waterislife.klwmedia.com | Sources: EWG, EPA UCMR 5, NRDC, SDWIS, TapWaterData
If your primary concern is mineral hardness or scale buildup rather than chemical contamination, see our comprehensive guide: Best Whole House Water Filters for Hard Water (2026) — covering softeners, salt-free conditioners, and combination systems across all budgets.
To understand the contamination data behind these ratings, see our comprehensive explainer: What Is PFAS in Drinking Water? — covering sources, health effects, which states are most affected, and how to remove PFAS from your water.
Not sure which filter technology addresses your state’s primary concern? See our guide: Reverse Osmosis vs Carbon Filter — Which One Do You Actually Need?
For a full overview of all filter types by contaminant and budget, see the Water Filter Comparison Guide.